
Secure Network Diagram Software | dEnterprise Atlas #1
Network Diagram Software – Visualize IT
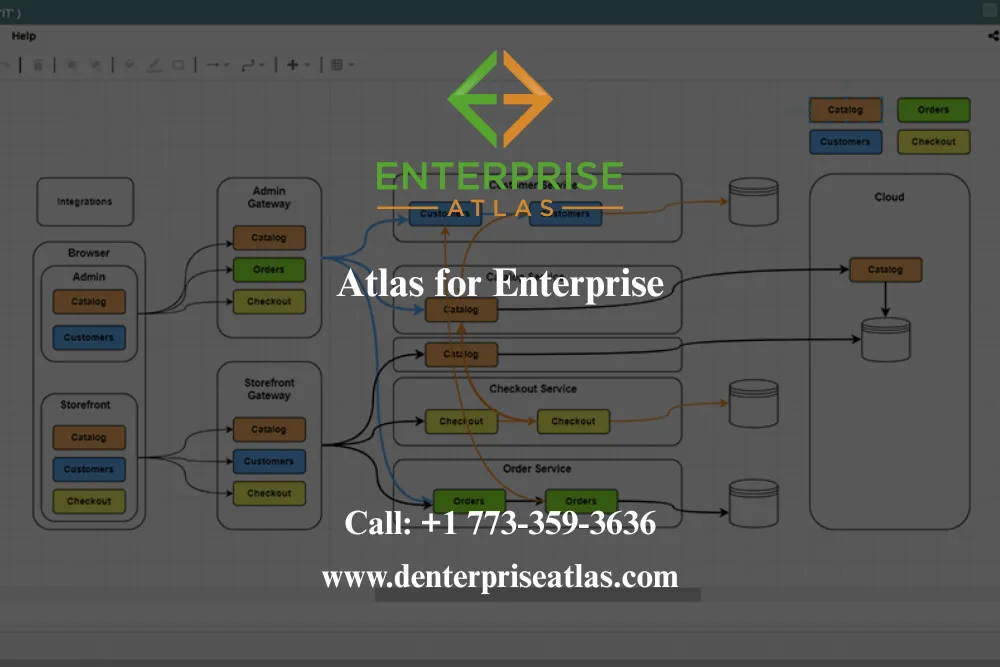
In today’s digital-first world, businesses rely on complex IT systems and cloud-based infrastructure to keep operations running smoothly. However, as networks grow, understanding how servers, routers, databases, and applications connect can quickly become overwhelming. That’s where network diagram software comes in.
With the right tool, you can visualize IT and cloud infrastructure in an organized, easy-to-understand format. This not only simplifies troubleshooting but also improves planning, security, and communication across teams.
About dEnterprise Atlas
dEnterprise Atlas is a company dedicated to creating intuitive and effective software solutions for teams and organizations. We focus on making complex processes simple, helping users visualize structures, collaborate efficiently, and manage projects with clarity. Our team is committed to continuous innovation, delivering tools that are easy to use while addressing real-world business needs.
Founded with the goal of improving workflow management, we prioritize user experience, reliability, and customer support. Our platform is designed to grow with your organization, offering flexibility and scalability to meet evolving requirements. At dEnterprise Atlas, we strive to empower teams to work more effectively and make informed decisions with confidence.
Why Choose dEnterprise Atlas for Network Diagram Software – Visualize IT
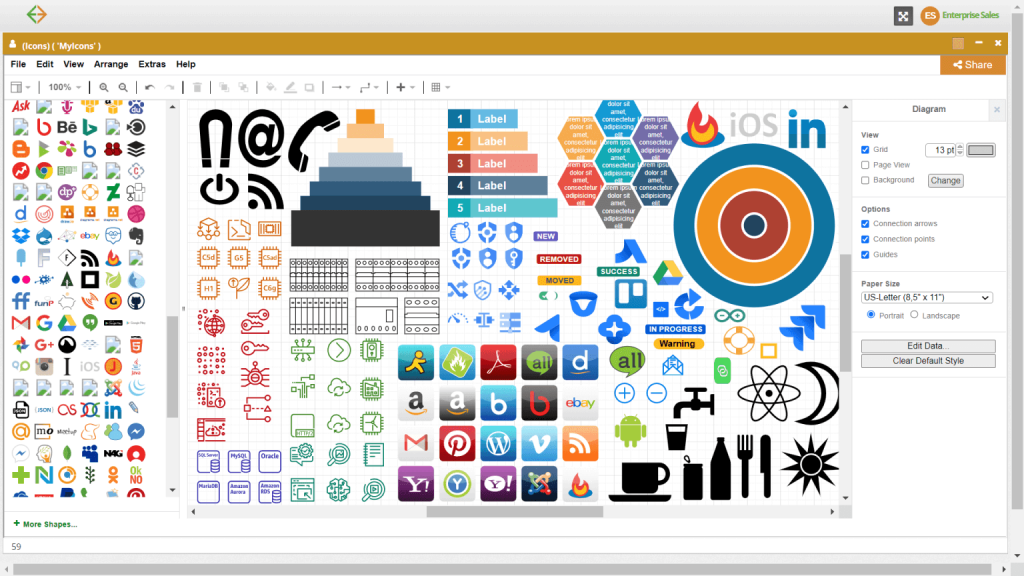
When it comes to managing IT infrastructure, clarity is critical, and dEnterprise Atlas is designed to deliver just that. With its intuitive drag-and-drop functionality, creating diagrams becomes effortless, even for complex systems. Real-time collaboration allows multiple team members to edit, comment, and update simultaneously, ensuring that everyone stays aligned. The platform includes customizable templates for LAN, WAN, cloud, and hybrid infrastructures, making it easy to get started quickly. It is also cloud-ready, offering dedicated support for AWS, Azure, Google Cloud, and hybrid environments.
Choose your plan
Simple pricing, No hidden charges. Choose a plan that fits your need!
Free
6 Months
$
0.00
-
Unlimited Editable Documents
-
Basic Collaboration
-
Basic Integrations
-
Basic Security
-
No admin controls
-
No Advanced data and automation
-
No SSO
Team
Starting at $5.99 USD/User (3 user minimum)
$
5.99
-
Unlimited Editable Documents
-
Advanced Collaboration
-
Advanced Integrations
-
Advanced Security
-
Basic Easy admin controls
-
No Advanced data and automation
-
No SSO
Popular
Enterprise
Contact us for a quote!
$
4.49
-
Unlimited Editable Documents
-
Advanced Collaboration
-
Advanced Integrations
-
Advanced Security
-
Advanced Easy admin controls
-
Advanced data and automation
-
SSO
Features of Our Network Diagram Software – Visualize IT
Our online platform is built with modern users in mind. Here’s what sets our Network Diagram Software – Visualize ITapart:
Drag-and-Drop Simplicity
No need for complex tutorials—our interface allows you to select shapes, connect steps, and design charts with ease.
Pre-Built Templates
From organizational charts and process flows to technical system diagrams, our template library accelerates your design process.
Real-Time Collaboration
Work simultaneously with colleagues no matter where they are. Everyone stays updated with instant changes and shared access.
Secure Cloud Storage
Your diagrams are always available, backed up, and protected with industry-leading security protocols.
Export & Sharing Options
Need to present your flowchart? Export it as PDF, PNG, or SVG—or share a live link directly with stakeholders.
Cross-Device Compatibility
Access and edit your diagrams from desktop, tablet, or smartphone. Perfect for teams on the go.
How Our Process Works
Using dEnterpriseatlas Network Diagram Software – Visualize IT is designed to be effortless, whether you’re a first-time user or an experienced professional. We built the process around simplicity, collaboration, and efficiency so you can focus on ideas—not learning a complicated tool.
1. Sign Up and Access Your Dashboard
Getting started is quick. Once you create an account, you’ll enter a clean, intuitive dashboard that puts all your projects in one place. From here, you can start a new flowchart, manage existing diagrams, or organize files for different teams and projects. Everything is stored securely in the cloud, so your work is always accessible.
2. Choose a Template or Start from Scratch
Not sure where to begin? Our template library has professionally designed options for process flows, organizational charts, decision trees, and more. If you prefer flexibility, you can start with a blank canvas and build your diagram from the ground up. Either way, you’re in control of how your workflow is visualized.
3. Drag, Drop, and Connect Elements
Our drag-and-drop editor makes it easy to add shapes, connect arrows, and insert labels. You don’t need design skills—just select the elements you need and arrange them visually. Every adjustment happens in real time, and smart guides keep your diagrams neat and professional.
4. Collaborate and Share in Real Time
Work is rarely a solo effort. That’s why our platform allows you to invite teammates to view, edit, and comment on diagrams simultaneously. Changes are visible instantly, so there’s no need to email multiple versions or worry about outdated files. With role-based permissions, you decide who can edit, comment, or only view.
5. Export, Present, and Integrate
Once your flowchart is complete, it’s easy to share. Export it as a PDF for reports, a PNG for presentations, or an SVG for scalable use. You can also generate a secure share link to collaborate externally. Our software integrates seamlessly with tools you already use, ensuring your diagrams fit naturally into your workflow
Frequently Asked Question
It’s a digital tool that allows IT teams to visualize how network devices, servers, and cloud systems are connected, making infrastructure easier to manage.
It simplifies IT management by making infrastructure clear, supports better planning, and improves troubleshooting and collaboration.
You can create a network diagram online by choosing a template, dragging and dropping IT components like servers or routers, and connecting them to show how your system works.
No. Most modern network diagram tools are drag-and-drop, meaning you can build professional diagrams without technical drawing or coding skills.
Absolutely. Network diagram tools can represent both on-premises and cloud systems, making them ideal for hybrid infrastructures.
Get in Touch
Ready to simplify IT management and visualize your infrastructure with confidence?
- Address: 1371 N Wood Dale Rd, Wood Dale, IL 60191, United States
- Phone : +1 773-359-3636
- Follow Us On Facebook